Climate under Cover
Digital Dynamic Simulation in Plant Bio-Engineering

Plant Physiology and Growth

Photosynthesis, Stomata, and Plant Growth

This page converts CUC151, CUC155, and CUC160 into browser-based tools for leaf gas exchange, Blackman photosynthesis response, and dry-matter growth.

The page keeps the original comparison structure: CO2 and PAR sweeps for stomatal behavior, a classic saturation curve for light response, and a two-state plant growth model over 48 hours.

MATLAB sources are preserved in matlab-source/cuc151_160, including cuc151.m, cuc155.m, cuc160.m, findco2ver1.m, and soil160.m.
CUC151

Stomatal behavior and photosynthesis

Behavior model of stomata opening. Recreates the textbook comparison of photosynthesis, total resistance, respiration, leaf temperature, and stomatal resistance under changing CO2 concentration and PAR.

This mode compares photosynthesis and total resistance across three PAR levels as air CO2 changes.

Model Translation

Model mapping

  • CUC151 keeps the original CO2 and PAR sweep structure, but the leaf-equilibrium root is solved directly in JavaScript.

Shared Assumptions and Equations

Assumptions, equations, and symbols

  • CUC151 uses fixed air temperature, humidity, long-wave forcing, and cuticle resistance from the MATLAB example.
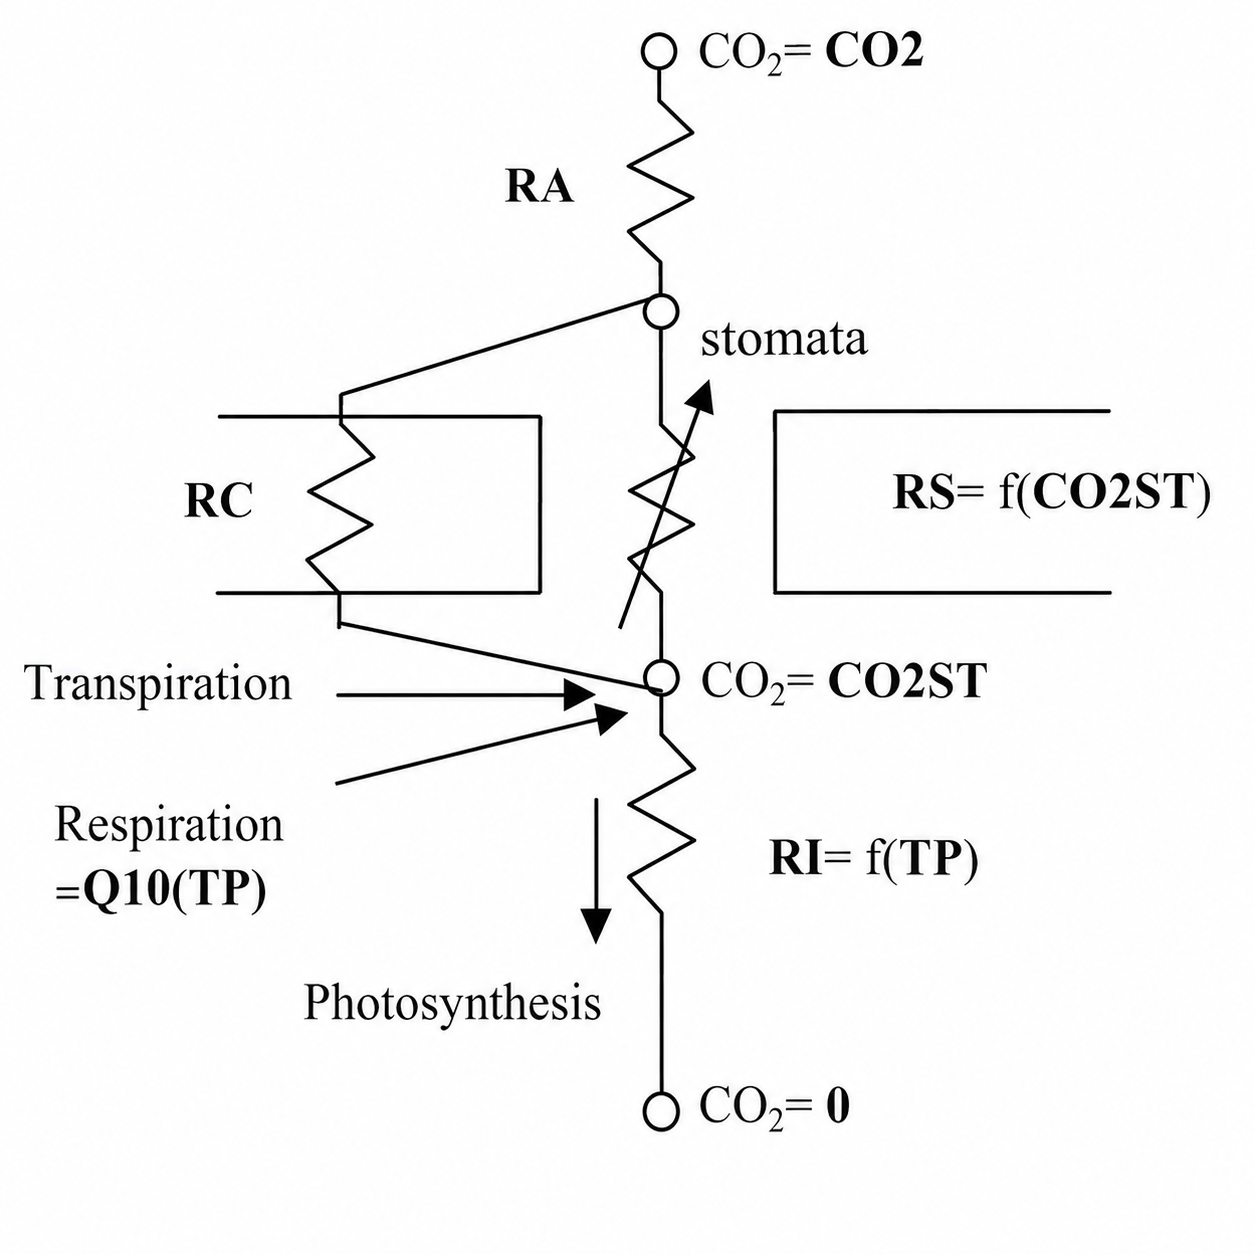
  • RT = RC * RS / (RC + RS). Here RC is cuticle resistance, RS is stomatal resistance, and RT is the parallel-equivalent total resistance in s/m.
  • PHOTO = min(EFF * PAR, 68.4 * CO2st / RI). Here PHOTO is photosynthetic rate (kgCO2/ha/hr), EFF is initial light-use efficiency, PAR is photosynthetically active radiation, CO2st is stomatal CO2 concentration (ppm), and RI is the leaf-temperature-dependent resistance term.
  • RESP = 5 * 2((TP - TREF)/10). Here RESP is respiration rate (kgCO2/ha/hr), TP is leaf temperature (°C), and TREF is the reference temperature (°C).
  • RI is given directly by RI = 250 for TP ≤ 12; RI = 250 - 16(TP - 12) for 12 < TP ≤ 17; RI = 170 - 8(TP - 17) for 17 < TP ≤ 22; RI = 130 - 4(TP - 22) for 22 < TP ≤ 27; RI = 110 - 2(TP - 27) for 27 < TP ≤ 32; RI = 100 + 4(TP - 32) for 32 < TP ≤ 37; RI = 120 + 8(TP - 37) for 37 < TP ≤ 42; and RI = 160 for TP > 42. Here TP is in °C and RI is in s/m.
  • RC is fixed at 4000 s/m in this model, representing the gas-exchange resistance through the cuticle pathway.

Basic Structure

Basic structure of cuc151 model

Basic structure of cuc151 model

The schematic highlights how ambient CO2, stomatal resistance, cuticle resistance, transpiration, respiration, and photosynthesis are coupled in the CUC151 leaf model.

CUC155

Blackman's expression

Blackman's Expression. Plots the saturating Blackman light-response curve together with the linear efficiency line and the PMAX ceiling.

Model Translation

Model mapping

  • CUC155 preserves the textbook Blackman expression and the matching linear efficiency line.

Shared Assumptions and Equations

Assumptions, equations, and symbols

  • CUC155 keeps the original Blackman expression, while allowing PMAX, EFF, and the PAR range to be adjusted in the browser.
  • PHOTO = PMAX * EFF * PAR / (PMAX + EFF * PAR). Here PHOTO is photosynthetic rate (kgCO2/ha/hr), PMAX is maximum photosynthetic rate (kgCO2/ha/hr), EFF is initial light-use efficiency [(kgCO2/ha/hr)/(kJ/m²/hr)], and PAR is photosynthetically active radiation (kJ/m²/hr).
  • PHOTOlinear = EFF * PAR. Here PHOTOlinear is the linear light-response estimate (kgCO2/ha/hr).
  • PHOTOmax = PMAX. Here PHOTOmax is the saturation ceiling and equals PMAX.
  • The three curves therefore compare the Blackman response, the linear efficiency line, and the PMAX ceiling under the same PAR axis.

CUC160

Plant dry weight increase

Plant growth model. Tracks accumulated dry matter and leaf-number increase with sinusoidal temperature, PAR, and CO2 forcing over 48 hours.

Model Translation

Model mapping

  • CUC160 keeps the original two-state growth structure for dry matter and leaf number.

Shared Assumptions and Equations

Assumptions, equations, and symbols

  • CUC160 keeps the original forcing structure for temperature, CO2, and daytime PAR, while exposing means, amplitudes, and simulation length as inputs.
  • TP = T0 + TU * sin(ω(t - 8)). Here TP is leaf temperature (°C), T0 is mean leaf temperature (°C), TU is the amplitude of leaf-temperature variation (°C), t is time in hr, and ω = 2π / 24 is in hr-1.
  • CO2 = CO20 + CO2U * sin(ω(t + 6)). Here CO20 is mean CO2 concentration (ppm) and CO2U is the amplitude of CO2 variation (ppm).
  • dWGT/dt = E * (PHOTO - RESP * WGT). Here WGT is accumulated dry matter (g), E is a conversion coefficient, PHOTO is photosynthetic rate, and RESP is the respiration term.
  • dNL/dt = RESP * RTPTB(TP). Here NL is leaf number and RTPTB is the temperature-response factor for leaf-number increase.
  • RTPTB(TP) is the temperature-response factor for leaf-number increase and is piecewise: RTPTB = 0 for TP ≤ 8 or TP ≥ 50; RTPTB = 0.55(TP - 8)/4 for 8 < TP ≤ 12; RTPTB = 0.55 + (TP - 12)(1 - 0.55)/18 for 12 < TP ≤ 30; RTPTB = 1 for 30 < TP ≤ 35; and RTPTB = 1 - (TP - 35)/15 for 35 < TP < 50. It is dimensionless and TP is leaf temperature in °C.
  • LAI = NP * DELTA / BETA * ln(1 + exp(BETA * (NL - NB))), where LAI is leaf area index (m2/m2), NP is plant density (number of plants per m2), DELTA and BETA are leaf-area growth coefficients, NL is leaf number, and NB is the reference leaf number.